General description
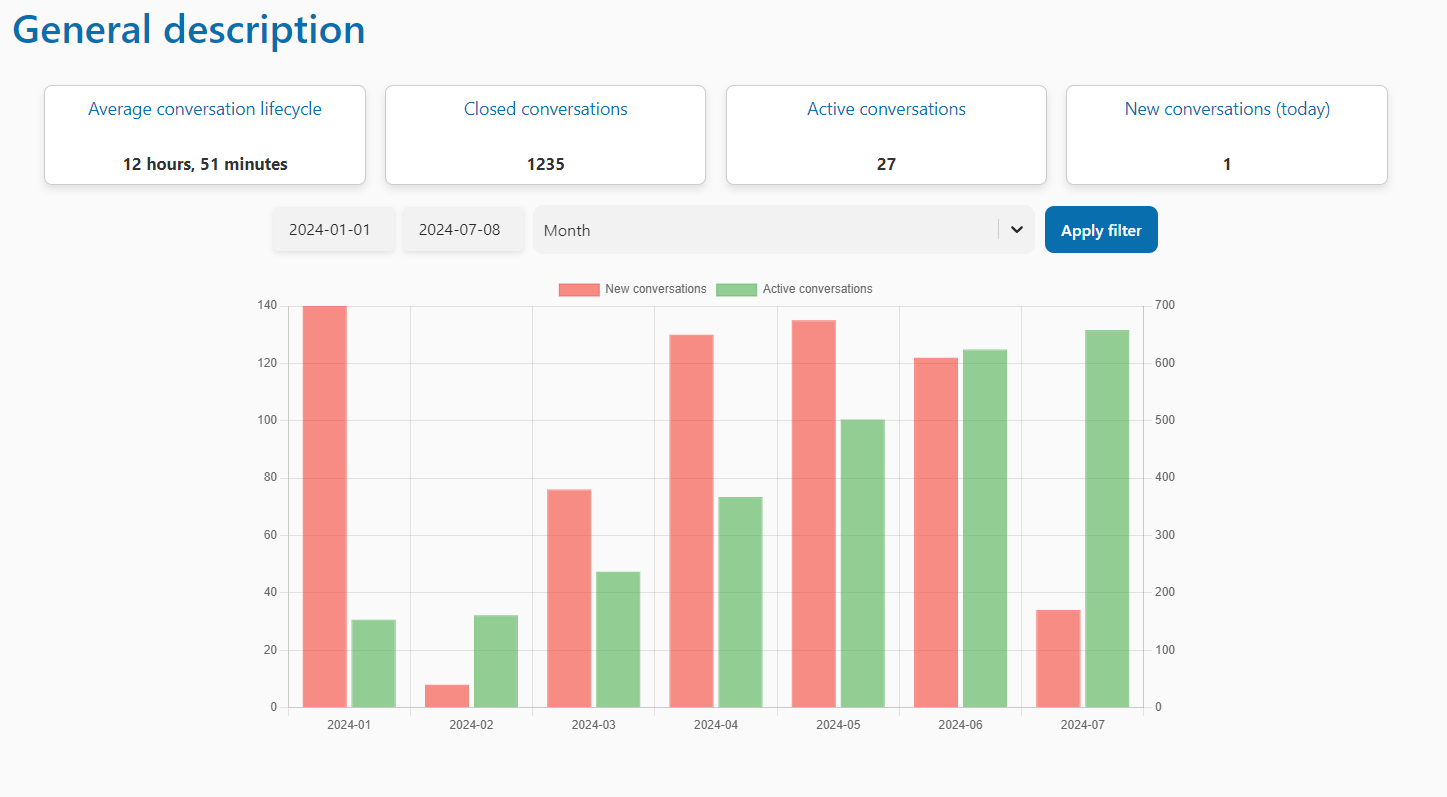
In this section, you will be able to see statistics about conversations such as the average conversation lifecycle, closed and active conversations, and lastly, new daily conversations.
You will be able to filter these conversations by day, week, or month. Simply apply a time range below the boxes, and it will be reflected in the bar chart, where red indicates new conversations and green indicates active conversations.